
Just register for the free trial below and we will send you everything you need to evaluate QuickBooks Online including 30-day access, the full 76-page QuickBooks Online Guide (details everything that you can do in the software) plus the video training library. Free end-to-end consultation and support are included so if you need any help along the way, just let us know!


One of the most critical financial reports in QuickBooks Online that businesses rely on is the Profit and Loss (P&L) statement. Whether you need to assess changes over time, track financial data by customer or tag group, or understand the proportional impact of expenses on your income, the P&L report provides valuable information for decision-making.
In this guide, we will cover advanced P&L reporting in QuickBooks Online, how to create customized P&L reports, and various ways to analyze your financial data.
What is the Profit and Loss Report?
The Profit and Loss report, also known as an income statement, is a financial statement that provides a summary of a business’s revenues, costs, and expenses over a specific period, typically a month, quarter, or year. The primary purpose of the P&L report is to show whether a business is generating a profit or incurring a loss during that period.
Advanced Profit and Loss Reports
There are different ways to customize profit and loss reports. Below we’ll share some of the advanced P&L reports you can create in QuickBooks.
Profit and Loss Comparison
The Profit and Loss comparison report in QuickBooks Online allows you to assess how your financial performance has changed over time by comparing P&L reports from different periods. This report provides a side-by-side comparison, helping you understand trends and variations in your income and expenses.
This report is invaluable when you want to evaluate the evolution of your business’s financial health. It’s best suited for identifying changes in profitability, analyzing seasonality, or comparing financial performance between different years or months.
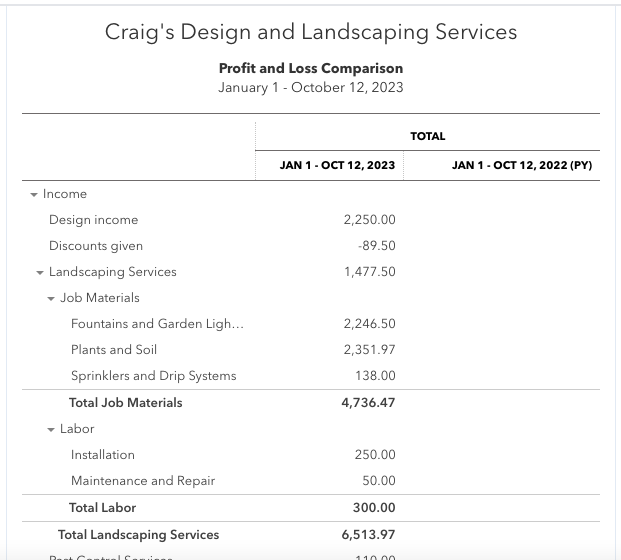
Sample Profit and Loss Comparison report in QuickBooks Online
Profit and Loss by Tag Group
QuickBooks Online enables you to categorize transactions by using tags. The Profit and Loss by tag group report allows you to analyze income and expenses based on these custom tags. This report offers a way to dissect your financial data, such as costs related to specific projects, departments, or categories.
This report is beneficial when you want to gain insights into how different segments of your business contribute to your financial performance. It’s especially useful for understanding the financial impact of various projects, cost centers, or custom categories.
Profit and Loss by Customer
The P&L by customer report breaks down your income and expenses by individual customers or clients. It provides a clear view of which customers are the most significant contributors to your financial results.
Use this report when you want to assess the profitability of your client base. It helps identify your most valuable clients and understand which customers may be incurring significant expenses. This report is particularly useful for service-based businesses and freelancers.
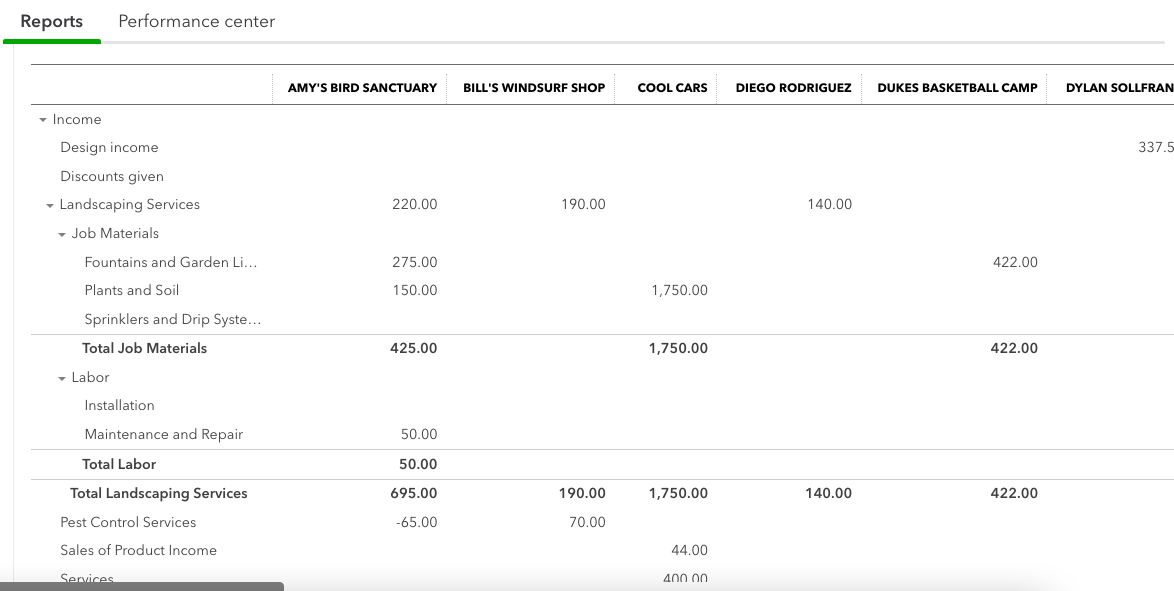
Sample Profit and Loss by Customer in QuickBooks Online
Profit and Loss as a % of Total Income
This report expresses your expenses as a percentage of your total income. It helps you assess the relative impact of different expense categories on your overall financial performance.
Use this report when you want to understand the proportion of each expense category relative to your total income. It’s especially valuable for evaluating cost efficiency and determining which expense areas have the most substantial influence on your profitability.
Profit and Loss by Month
The P&L by month report provides a month-by-month breakdown of your income and expenses. It allows you to assess your financial performance over time and identify patterns or fluctuations. This report is crucial for understanding how your business performs on a monthly basis. It helps you identify seasonality, trends, or changes in revenue and expenses throughout the year. Monthly P&L reports are invaluable for budgeting, forecasting, and strategic planning.
Profit and Loss Year-to-Date Comparison
The Profit and Loss Year-to-Date Comparison report in QuickBooks Online provides a comprehensive view of your financial performance over the current year, compared to the previous year. It offers a year-to-date perspective of your income, expenses, and profitability.
This report is highly useful for assessing your financial performance throughout the current year and comparing it to the previous year. It allows you to identify year-over-year trends, such as revenue growth or cost increases, and make strategic financial decisions.
Quarterly Profit and Loss Summary
The Quarterly Profit and Loss Summary report allows you to analyze your income and expenses in quarterly segments. It provides a concise overview of your financial performance for each quarter, aiding in identifying seasonal patterns or assessing quarterly profitability.
It’s ideal for businesses that experience seasonal fluctuations or want to assess their performance on a quarterly basis. This report helps in budgeting, planning, and making adjustments throughout the year.
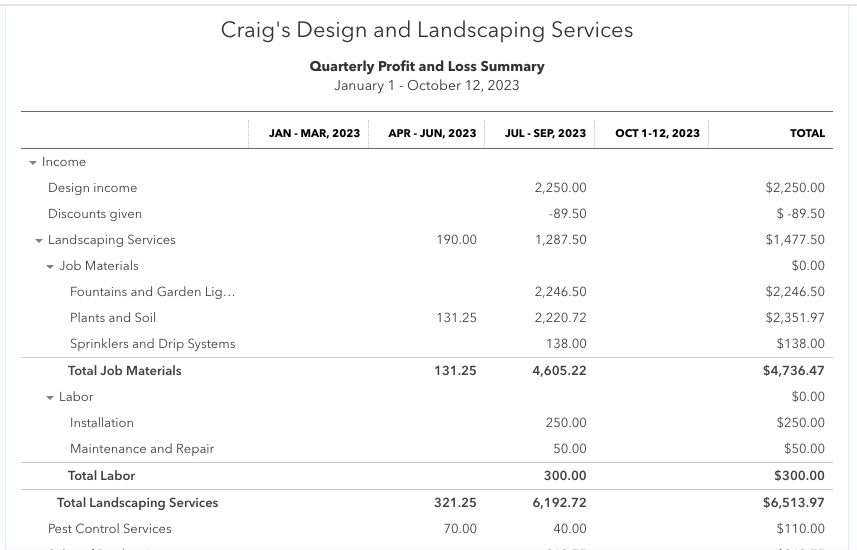
Sample Quarterly Profit and Loss Report in QuickBooks Online
Wrap Up
Advanced profit & loss reporting in QuickBooks Online offers a comprehensive suite of tools to help businesses gain deeper insights into their financial performance. By customizing and utilizing these advanced reports effectively, you can better understand your business’s financial health and position it for sustainable growth and success.

Why QuickBooks Online Is a Game-Changer for Small Business Accounting
For small business owners, managing finances can feel like a constant balancing act, trying to stay on...

Can I Use the QuickBooks Online Test Drive to Test integrations?
QuickBooks Online can have a learning curve, especially for new users or businesses trying to integrate...

How Can I Contact QuickBooks Online Support?
Navigating QuickBooks Online can sometimes be challenging, especially when issues arise that require...

How Much Does Each QuickBooks Online Plan Cost per Month?
QuickBooks Online offers a range of subscription plans designed to meet the diverse needs of businesses...

QuickBooks Online Advanced vs Enterprise: A Detailed Comparison
QuickBooks offers two robust solutions for businesses ready to step up from basic accounting software:...

QuickBooks Online vs Desktop: Differences & When to Use Each
QuickBooks, a popular accounting software, offers two main versions: QuickBooks Online and QuickBooks...

Is There a Specific Time of the Month that's Best for Migrating to QuickBooks Online?
Migrating to QuickBooks Online can be a transformative step for your business, offering improved accessibility,...

Can QuickBooks Online Integrate with My Point-of-Sale (POS) System?
Efficient financial management requires seamless integration between your Point-of-Sale (POS) system...

Why Should I Migrate from QuickBooks Self-Employed to QuickBooks Online?
Migrating from QuickBooks Self-Employed (QBSE) to QuickBooks Online (QBO) can significantly enhance your...

How Does QuickBooks Online Handle Sales Taxes?
Managing sales tax is a crucial aspect of running a business. It can be complex and time-consuming, but...

Can I Import My Data From Another Accounting Software to QuickBooks Online?
Transitioning to a new accounting software can seem daunting, especially when considering the need to...

How Does QuickBooks Online Help With Project Management for Marketing Agencies?
QuickBooks Online offers a suite of tools that can significantly enhance project management for marketing...